360 Finance Announces Fourth Quarter and Full Year 2018 Unaudited Financial Results
SHANGHAI, China,
|
|||||
Fourth Quarter Operational Highlights
- Loan origination volume*1 was
RMB33,008 million , representing an increase of 159% fromRMB12,764 million in the same period of 2017, and an increase of 23% fromRMB26,925 million in the third quarter of 2018. - Outstanding loan balance*2 was
RMB43,077 million as ofDecember 31, 2018 , an increase of 254% fromRMB12,171 million as ofDecember 31, 2017 , and an increase of 25% fromRMB34,339 million as ofSeptember 30, 2018 . - The weighted average tenor of loans originated in the fourth quarter of 2018 was approximately 8.37 months, compared to 7.08 months in the same period of 2017, and 8.57 months in the third quarter of 2018.
- Users with approved credit lines*3 was 12.54 million as of
December 31, 2018 , an increase of 280% from 3.30 million as ofDecember 31, 2017 , and an increase of 30% from 9.64 million as ofSeptember 30, 2018 . - Cumulative borrowers with successful drawdown, including repeat borrowers was 8.28 million as of
December 31, 2018 , an increase of 262% from 2.29 million as ofDecember 31, 2017 , and an increase of 28% from 6.44 million as ofSeptember 30, 2018 . - 90 day+ delinquency ratio*4 was 0.92% as of
December 31, 2018 . - The percentage of funding from financial institutions*5 in the fourth quarter was 78%.
1 "Loan origination volume" refers to the total principal amount of loans originated through the Company’s platform during the given period.
2 "Outstanding loan balance" refers to the total amount of principal outstanding for loans originated through the Company’s platform at the end of each period.
3 "Users with approved credit lines" refers to the total number of users who had submitted their credit applications and were approved with a credit line by the Company at the end of each period.
4 "90 day+ delinquency ratio" refers to the outstanding principal balance of on- and off-balance sheet loans that were 90 to 179 calendar days past due as a percentage of the total outstanding principal balance of on- and off-balance sheet loans on our platform as of a specific date. Loans that are charged-off are not included in the delinquency rate calculation.
5 "The percentage of funding from financial institutions" is based on cumulative loan origination during the given period.
Fourth Quarter 2018 Financial Highlights
- Total net revenue increased by 261% to
RMB1,566.4 million (US$227.8 million ) fromRMB434.2 million in the same period of 2017. - Income from operations increased by 264% to
RMB695.0 million (US$101.0 million ) fromRMB191.1 million in the same period of 2017. - Non-GAAP*6 income from operations increased by 304% to
RMB 772.4 million (US$112.3 million ) fromRMB191.1 million in the same period of 2017. - Operating margin was 44.4%. Non-GAAP operating margin was 49.3%, compared to 44.0% in the same period of 2017.
- Net income increased by 300% to
RMB594.7 million (US$86.5 million ) fromRMB148.7 million in the same period of 2017. - Non-GAAP net income increased by 352% to
RMB672.1 million (US$97.8 million ) fromRMB148.7 million in the same period of 2017. - Net income margin was 38.0%. Non-GAAP net income margin was 42.9%, compared to 34.2% in the same period of 2017.
6 Non-GAAP income from operations (Adjusted Income from operations) and Non-GAAP net income (Adjusted net income) are non-GAAP financial measures. For more information on this non-GAAP financial measure, please see the section of “Use of Non-GAAP Financial Measures Statement” and the table captioned "Unaudited Reconciliations of GAAP and Non-GAAP Results" set forth at the end of this press release.
Full Year 2018 Operational Highlights
- Total loan origination volume in 2018 was
RMB95,984 million , representing an increase of 210% fromRMB30,992 million in 2017. - The weighted average tenor of loans originated was 8.52 months in full year 2018, compared to 7.23 months in 2017.
- Repeat borrower contribution*7 was 57.9% in full year 2018, compared to 53.9% in 2017.
7 "Repeat borrower contribution" for a given period refers to (i) the principal amount of loans borrowed during that period by borrowers who had historically made at least one successful drawdown, divided by (ii) the total loan origination volume through our platform during that period.
Full Year 2018 Financial Highlights
- Total net revenue increased by 464% to
RMB4,447.0 million (US$646.7 million ) fromRMB788.1 million in 2017. - Income from operations increased by 680% to
RMB1,644.5 million (US$239.1 million ) fromRMB210.5 million in 2017. - Non-GAAP income from operations increased by 969% to
RMB2,251.8 million (US$327.5 million ) fromRMB210.5 million in 2017. - Operating margin was 37.0%. Non-GAAP operating margin was 50.6%, compared to 26.7% in 2017.
- Net income increased by 624% to
RMB1,193.3 million (US$173.5 million ) fromRMB164.8 million in 2017. - Non-GAAP net income increased by 992% to
RMB1,800.7 million (US$261.9 million ) fromRMB164.8 million in 2017. - Net income margin was 26.8%. Non-GAAP net income margin was 40.5%, compared to 20.9% in the same period of 2017.
Mr. Jun Xu, Chief Executive Officer and Director of 360 Finance, commented, “We were able to generate significant operational and financial growth throughout the year despite turbulent market conditions and regulatory uncertainties. Over the past year, we have built a strong network connecting numerous of national and regional banks with more than ten million users in China. We are focusing our efforts on rolling out several innovative projects in 2019 including building a fintech enabling platform and facilitating more loans to SME owners. We believe these projects will strengthen our leading position in the industry, further differentiate ourselves in the market, and accelerate future business growth.”
Mr. Jiang Wu, Chief Financial Officer of 360 Finance, added, “While we faced a challenging market environment in 2018, we were able to generate strong results to finish out the year. For full year 2018, we delivered total net revenue of
Mr. Yan Zheng, Vice President of 360 Finance, commented, “The credit quality of our customers remains stable so we do not see any material impact from an annualized risk performance perspective. We continue to test risk behavior in different user trenches and loan tenors with the results applied to our new products and risk management systems. We remain confident in our ability to support our business partners with our widening array of products, platforms, and big data capabilities.”
Accounting Policy Change
As announced on
Fourth Quarter 2018 Financial Results
Total net revenues increased by 261% to
Revenue from loan facilitation services increased by 322% to
Revenue from post-origination services increased by 554% to
Financing income*8 decreased by 7% to
Other service fee revenues increased by 16% to
Total operating costs and expenses increased by 258% to
Origination and servicing expenses increased by 280% to
Sales and marketing expenses increased by 220% to
General and administrative expenses increased by 928% to
Provision for loans receivable decreased by 5% to
Provision for financial assets receivable increased by 233% to
Provision for accounts receivable and contract assets increased by 245% to
Income from operations increased by 264% to
Non-GAAP income from operations increased by 304% to
Operating margin was 44.4%. Non-GAAP operating margin was 49.3%, compared to non-GAAP operating margin of 44.0% in the same period of 2017.
Income before income tax expense was
Income tax expense was
Net income increased by 300% to
Non-GAAP net income increased by 352% to
Net income margin was 38.0%. Non-GAAP net income margin was 42.9%, compared to non-GAAP net income margin of 34.2% in the same period of 2017.
8 "Financing income" is defined as loans through the consolidated trusts and Fuzhou Microcredit and charge fees and interests from borrowers.
Full Year 2018 Financial Results
Total net revenues increased by 464% to
Revenue from loan facilitation services increased by 462% to
Revenue from post-origination services increased by 697% to
Financing income increased by 425% to
Other service fee revenues increased by 248% to
Total operating costs and expenses increased by 385% to
Origination and servicing expenses increased by 435% to
Sales and marketing expenses increased by 282% to
General and administrative expenses increased by 1137% to
Provision for loans receivable increased by 258% to
Provision for financial assets receivable increased by 231% to
Provision for accounts receivable and contract assets increased by 295% to
Income from operations increased by 680% to
Non-GAAP income from operations increased by 969% to
Operating margin was 37.0%. Non-GAAP operating margin was 50.6%, compared to non-GAAP operating margin of 26.7% in 2017.
Income before income tax expense was
Income tax expense was
Net income increased by 624% to
Non-GAAP net income increased by 992% to
Net income margin was 26.8%. Non-GAAP net income margin was 40.5%, compared to non-GAAP net income margin of 20.9% in the same period of 2017.
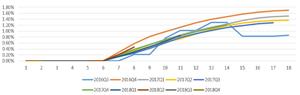
M6+ Delinquency Rate by Vintage
The following chart and table display the historical cumulative M6+ delinquency rates by loan origination vintage for all loans originated through the company’s platform:
A graphic accompanying this announcement is available at http://www.globenewswire.com/NewsRoom/AttachmentNg/d23adbe4-4ac4-4a35-b36b-a5aba068e95e
Business Outlook
360 Finance currently expects total net revenue for the fiscal year of 2019 to be in the range of
Conference Call
360 Finance's management team will host an earnings conference call at 8:00 AM U.S. Eastern Time on Wednesday, March 20, 2019 (8:00 PM Beijing Time on March 20, 2019).
Dial-in details for the earnings conference call are as follows:
| United States: | 1-888-346-8982 |
| Hong Kong: | 800-905-945 |
| China: | 4001-201-203 |
| International: | 1-412-902-4272 |
| Passcode: | 360 Finance |
Please dial in 15 minutes before the call is scheduled to begin and provide the passcode to join the call.
A replay of the conference call may be accessed by phone one hour after the end of the conference call until March 27, 2019 at the following numbers:
| United States: | 1-877-344-7529 |
| International: | 1-412-317-0088 |
| Passcode: | 10129566 |
Additionally, a live and archived webcast of the conference call will be available on the Investor Relations section of the Company’s website at http://ir.360jinrong.net/investor-relations.
About 360 Finance
360
For more information, please visit: http://ir.360jinrong.net/investor-relations
Use of Non-GAAP Financial Measures Statement
To supplement our financial results presented in accordance with U.S. GAAP, we use non-GAAP financial measure, which is adjusted from results based on U.S. GAAP to exclude share-based compensation expenses. Reconciliations of our non-GAAP financial measures to our U.S. GAAP financial measures are set forth in tables at the end of this earnings release, which provide more details on the non-GAAP financial measures.
We use non-GAAP income from operation and non-GAAP net income in evaluating our operating results and for financial and operational decision-making purposes. Non-GAAP income from operation represents income from operation excluding share-based compensation expenses, and non-GAAP net income represents net income excluding share-based compensation expenses. Such adjustments have no impact on income tax. We believe that non-GAAP income from operation and non-GAAP net income help identify underlying trends in our business that could otherwise be distorted by the effect of certain expenses that we include in results based on U.S. GAAP. We believe that non-GAAP income from operation and non-GAAP net income provide useful information about our operating results, enhance the overall understanding of our past performance and future prospects and allow for greater visibility with respect to key metrics used by our management in its financial and operational decision-making. Our non-GAAP financial information should be considered in addition to results prepared in accordance with U.S. GAAP, but should not be considered a substitute for or superior to U.S. GAAP results. In addition, our calculation of non-GAAP financial information may be different from the calculation used by other companies, and therefore comparability may be limited.
Exchange Rate Information
This announcement contains translations of certain RMB amounts into U.S. dollars at specified rates solely for the convenience of the reader. Unless otherwise noted, all translations from RMB to U.S. dollars are made at a rate of
Safe Harbor Statement
Any forward-looking statements contained in this announcement are made under the "safe harbor" provisions of the U.S. Private Securities Litigation Reform Act of 1995. Forward-looking statements can be identified by terminology such as "will," "expects," "anticipates," "future," "intends," "plans," "believes," "estimates" and similar statements. 360 Finance may also make written or oral forward-looking statements in its reports to the
For more information, please contact:
360 Finance
Mr. George Shao
E-mail: ir@360jinrong.net
Christensen
In China
Mr. Christian Arnell
Phone: +86-10-5900-1548
E-mail: carnell@christensenir.com
In US
Ms. Linda Bergkamp
Phone: +1-480-614-3004
Email: lbergkamp@christensenir.com
| Unaudited Condensed Consolidated Balance Sheets | ||||||
| (Amounts in thousands of Renminbi ("RMB") and U.S. dollars ("USD") | ||||||
| except for number of shares and per share data, or otherwise noted) | ||||||
| December 31, | December 31, | December 31, | ||||
| 2017 | 2018 | 2018 | ||||
| RMB | RMB | USD | ||||
| ASSETS | ||||||
| Current assets: | ||||||
| Cash and cash equivalents | 468,547 | 1,445,802 | 210,283 | |||
| Restricted cash | 487,882 | 567,794 | 82,582 | |||
| Security deposit prepaid to third-party guarantee companies | - | 795,700 | 115,730 | |||
| Funds receivable from third party payment service providers | 132,479 | 142,622 | 20,744 | |||
| Accounts receivable and contract assets, net | 327,103 | 1,791,745 | 260,599 | |||
| Financial assets receivable, net | 270,122 | 1,193,621 | 173,605 | |||
| Amounts due from related parties | 105,219 | 484,286 | 70,436 | |||
| Loans receivable, net | 1,192,307 | 811,433 | 118,018 | |||
| Prepaid expenses and other assets | 33,907 | 109,016 | 15,855 | |||
| Total current assets | 3,017,566 | 7,342,019 | 1,067,852 | |||
| Non-current assets: | ||||||
| Property and equipment, net | 5,994 | 6,869 | 999 | |||
| Intangible assets | 262 | 847 | 123 | |||
| Deferred tax assets | 75,536 | - | - | |||
| Total non-current assets | 81,792 | 7,716 | 1,122 | |||
| TOTAL ASSETS | 3,099,358 | 7,349,735 | 1,068,974 | |||
| LIABILITIES AND EQUITY LIABILITIES |
||||||
| Current liabilities: | ||||||
| Payable to investors of the consolidated trusts | 536,906 | 300,341 | 43,683 | |||
| Accrued expenses and other current liabilities | 96,737 | 518,955 | 75,479 | |||
| Amounts due to related parties | 1,283,970 | 78,767 | 11,456 | |||
| Guarantee liabilities | 300,942 | 1,399,174 | 203,501 | |||
| Income tax payable | 115,325 | 432,066 | 62,841 | |||
| Other tax payable | 31,329 | 164,478 | 23,922 | |||
| Total current liabilities | 2,365,209 | 2,893,781 | 420,882 | |||
| Non-current liabilities: | ||||||
| Deferred tax liabilities | - | 15,758 | 2,292 | |||
| Total non-current liabilities | - | 15,758 | 2,292 | |||
| TOTAL LIABILITIES | 2,365,209 | 2,909,539 | 423,174 | |||
| Ordinary shares | - | 20 | 3 | |||
| Parent company’s investment | 590,000 | - | - | |||
| Additional paid-in capital | - | 4,866,756 | 707,840 | |||
| Accumulated (deficit)/Retained earnings | 144,149 | (430,263) | (62,579) | |||
| Other comprehensive income | - | 3,683 | 536 | |||
| TOTAL EQUITY | 734,149 | 4,440,196 | 645,800 | |||
| TOTAL LIABILITIES AND EQUITY | 3,099,358 | 7,349,735 | 1,068,974 | |||
| Unaudited Condensed Consolidated Statements of Operations | ||||||
| (Amounts in thousands of Renminbi ("RMB") and U.S. dollars ("USD") | ||||||
| except for number of shares and per share data, or otherwise noted) | ||||||
| Three months ended December 31, | ||||||
| 2017 | 2018 | 2018 | ||||
| RMB | RMB | USD | ||||
| Revenue from loan facilitation services | 253,369 | 1,068,558 | 155,415 | |||
| Revenue from post-origination services | 55,184 | 361,106 | 52,521 | |||
| Financing income | 38,770 | 35,797 | 5,206 | |||
| Other service fee revenues | 86,865 | 101,002 | 14,690 | |||
| Total net revenue | 434,188 | 1,566,463 | 227,832 | |||
| Origination and servicing | 59,307 | 225,511 | 32,799 | |||
| Sales and marketing | 149,044 | 477,283 | 69,418 | |||
| General and administrative | 10,625 | 109,307 | 15,898 | |||
| Provision for loans receivable | 9,273 | 8,781 | 1,277 | |||
| Provision for financial assets receivable | 6,449 | 21,536 | 3,132 | |||
| Provision for accounts receivable and contract assets | 8,394 | 29,022 | 4,221 | |||
| Total operating costs and expenses | 243,092 | 871,439 | 126,745 | |||
| Income from operations | 191,096 | 695,024 | 101,087 | |||
| Interest income | 1,047 | 3,557 | 517 | |||
| Foreign exchange gain | - | 582 | 85 | |||
| Income before income tax expense | 192,143 | 699,163 | 101,689 | |||
| Income tax expense | (43,452) | (104,433) | (15,189) | |||
| Net income | 148,691 | 594,730 | 86,500 | |||
| Deemed dividend | - | - | - | |||
| Net income attributable to ordinary shareholders of the Company | 148,691 | 594,730 | 86,500 | |||
| Net income per ordinary share attributable to ordinary shareholders of 360 Finance, Inc. | ||||||
| Basic | 0.75 | 2.10 | 0.31 | |||
| Diluted | 0.75 | 1.98 | 0.29 | |||
| Weighted average shares used in calculating net income per ordinary share | ||||||
| Basic | 198,347,168 | 215,819,991 | 215,819,991 | |||
| Diluted | 198,347,168 | 228,163,518 | 228,163,518 | |||
| Year ended December 31, | ||||||
| 2017 | 2018 | 2018 | ||||
| RMB | RMB | USD | ||||
| Revenue from loan facilitation services | 552,313 | 3,107,633 | 451,986 | |||
| Revenue from post-origination services | 95,037 | 757,957 | 110,240 | |||
| Financing income | 50,966 | 267,844 | 38,956 | |||
| Other service fee revenues | 89,828 | 313,584 | 45,609 | |||
| Total net revenue | 788,144 | 4,447,018 | 646,791 | |||
| Origination and servicing | 136,106 | 728,999 | 106,029 | |||
| Sales and marketing | 345,576 | 1,321,950 | 192,270 | |||
| General and administrative | 46,004 | 569,387 | 82,814 | |||
| Provision for loans receivable | 12,406 | 44,474 | 6,468 | |||
| Provision for financial assets receivable | 16,273 | 53,989 | 7,852 | |||
| Provision for accounts receivable and contract assets | 21,180 | 83,707 | 12,175 | |||
| Total operating costs and expenses | 577,545 | 2,802,506 | 407,608 | |||
| Income from operations | 210,599 | 1,644,512 | 239,183 | |||
| Interest income | 2,422 | 10,026 | 1,458 | |||
| Foreign exchange losses | - | (2,563) | (373) | |||
| Other (expense) income, net | 22 | 7,696 | 1,119 | |||
| Income before income tax expense | 213,043 | 1,659,671 | 241,387 | |||
| Income tax expense | (48,178) | (466,360) | (67,829) | |||
| Net income | 164,865 | 1,193,311 | 173,558 | |||
| Deemed dividend | - | (3,097,733) | (450,547) | |||
| Net income (loss) attributable to ordinary shareholders of the Company | 164,865 | (1,904,422) | (276,989) | |||
| Net income (loss) per ordinary share attributable to ordinary shareholders of 360 Finance, Inc. | ||||||
| Basic | 0.83 | (9.39) | (1.37) | |||
| Diluted | 0.83 | (9.39) | (1.37) | |||
| Weighted average shares used in calculating net income (loss) per ordinary share | ||||||
| Basic | 198,347,168 | 202,751,277 | 202,751,277 | |||
| Diluted | 198,347,168 | 202,751,277 | 202,751,277 | |||
| Unaudited Condensed Consolidated Statements of Comprehensive (Loss)/Income | ||||||
| (Amounts in thousands of Renminbi ("RMB") and U.S. dollars ("USD") | ||||||
| except for number of shares and per share data, or otherwise noted) | ||||||
| Three months ended December 31, | ||||||
| 2017 | 2018 | 2018 | ||||
| RMB | RMB | USD | ||||
| Net income | 148,691 | 594,730 | 86,500 | |||
| Other comprehensive income, net of tax of nil: | ||||||
| Foreign currency translation adjustment | - | (58) | (8) | |||
| Other comprehensive income (loss) | - | (58) | (8) | |||
| Total comprehensive income | 148,691 | 594,672 | 86,492 | |||
| Deemed dividend | - | - | - | |||
| Comprehensive income attributable to ordinary shareholders | 148,691 | 594,672 | 86,492 | |||
| Year ended December 31, | ||||||
| 2017 | 2018 | 2018 | ||||
| RMB | RMB | USD | ||||
| Net income | 164,865 | 1,193,311 | 173,558 | |||
| Other comprehensive income, net of tax of nil: | ||||||
| Foreign currency translation adjustment | - | 3,683 | 536 | |||
| Other comprehensive income | - | 3,683 | 536 | |||
| Total comprehensive income | 164,865 | 1,196,994 | 174,094 | |||
| Deemed dividend | - | (3,097,733) | (450,547) | |||
| Comprehensive income attributable to ordinary shareholders | 164,865 | (1,900,739) | (276,453) | |||
| Unaudited Reconciliations of GAAP and Non-GAAP Results | ||||||
| (Amounts in thousands of Renminbi ("RMB") and U.S. dollars ("USD") | ||||||
| except for number of shares and per share data, or otherwise noted) | ||||||
| Three months ended December 31, | ||||||
| 2017 | 2018 | 2018 | ||||
| RMB | RMB | USD | ||||
| Reconciliation of Adjusted Net Income to Net Income | ||||||
| Net income | 148,691 | 594,730 | 86,500 | |||
| Add: Share-based compensation expenses | - | 77,357 | 11,251 | |||
| Adjusted net income | 148,691 | 672,087 | 97,751 | |||
| adjusted net income margin | 34.2% | 42.9% | ||||
| Reconciliation of Adjusted Income from operations to Income from operations | ||||||
| Income from operations | 191,096 | 695,024 | 101,087 | |||
| Add: Share-based compensation expenses | - | 77,357 | 11,251 | |||
| Adjusted Income from operations | 191,096 | 772,381 | 112,338 | |||
| adjusted opreating margin | 44.0% | 49.3% | ||||
| Year ended December 31, | ||||||
| 2017 | 2018 | 2018 | ||||
| RMB | RMB | USD | ||||
| Reconciliation of Adjusted Net Income to Net Income | ||||||
| Net income | 164,865 | 1,193,311 | 173,560 | |||
| Add: Share-based compensation expenses | - | 607,381 | 88,340 | |||
| Adjusted net income | 164,865 | 1,800,692 | 261,900 | |||
| adjusted net income margin | 20.9% | 40.5% | ||||
| Reconciliation of Adjusted Income from operations to Income from operations | ||||||
| Income from operations | 210,599 | 1,644,512 | 239,184 | |||
| Add: Share-based compensation expenses | - | 607,381 | 88,340 | |||
| Adjusted Income from operations | 210,599 | 2,251,893 | 327,524 | |||
| adjusted opreating margin | 26.7% | 50.6% | ||||